Spectrogram Reading for SLPs: A Visual Guide to Voice Quality
Key Takeaways
- 1Narrowband spectrograms are essential for clinical voice assessment—they reveal harmonic structure, F0, subharmonics, and periodicity
- 2Always classify voice signal type (1–4) before calculating acoustic measures—a 2026 systematic review describes typing as the gatekeeper that decides which measures are valid (Hegde et al., 2026)
- 3Type 1 signals allow perturbation measures; Types 2–4 rely on cepstral measures, visual analysis, and perceptual rating
- 4Interharmonic noise indicates breathiness; subharmonics indicate alternating vibratory cycles; wavy harmonics indicate instability
- 5Signal type can change within a single sample—one in five severe pediatric samples contained multiple types (Park et al., 2025); type the segment you analyze
- 6Spectrograms inform clinical hypotheses but don't diagnose—laryngeal visualization is always required for definitive diagnosis
- 7Adjust window length for high-pitched voices—standard “wideband” settings start resolving harmonics for women and children
The spectrogram is arguably the most powerful visual tool in voice assessment. Unlike single-number measures like jitter or CPP, a spectrogram displays all facets of vocal sound in a single picture—fundamental frequency, harmonics, noise, stability, voice breaks, and more. Yet many clinicians find spectrograms intimidating, uncertain how to translate those colorful bands into clinical insight.
This guide will demystify spectrogram interpretation for clinical voice assessment. You'll learn the critical difference between wideband and narrowband displays, how to classify voice signals using the Titze/Sprecher typing system (essential for knowing which acoustic measures are valid), and what specific visual patterns tell you about voice quality and pathology.
What a Spectrogram Actually Shows
A spectrogram is a three-dimensional representation of sound compressed into two dimensions. The horizontal axis represents time, the vertical axis represents frequency, and the darkness or color intensity represents amplitude (energy) at each time-frequency point.
Think of it as taking thousands of frequency snapshots of your audio and stacking them side by side. Dark regions indicate strong energy at that frequency and time; light or white regions indicate little energy.
The Fundamental Trade-Off
Spectrograms face an inherent physics constraint: you can have excellent time resolution or excellent frequency resolution, but not both simultaneously. This is why we have two types of spectrograms—wideband and narrowband—each optimized for different clinical questions.
Wideband vs. Narrowband: Which to Use When
The distinction between wideband and narrowband spectrograms is the most important concept for clinical spectrogram reading. Each reveals different aspects of voice production.
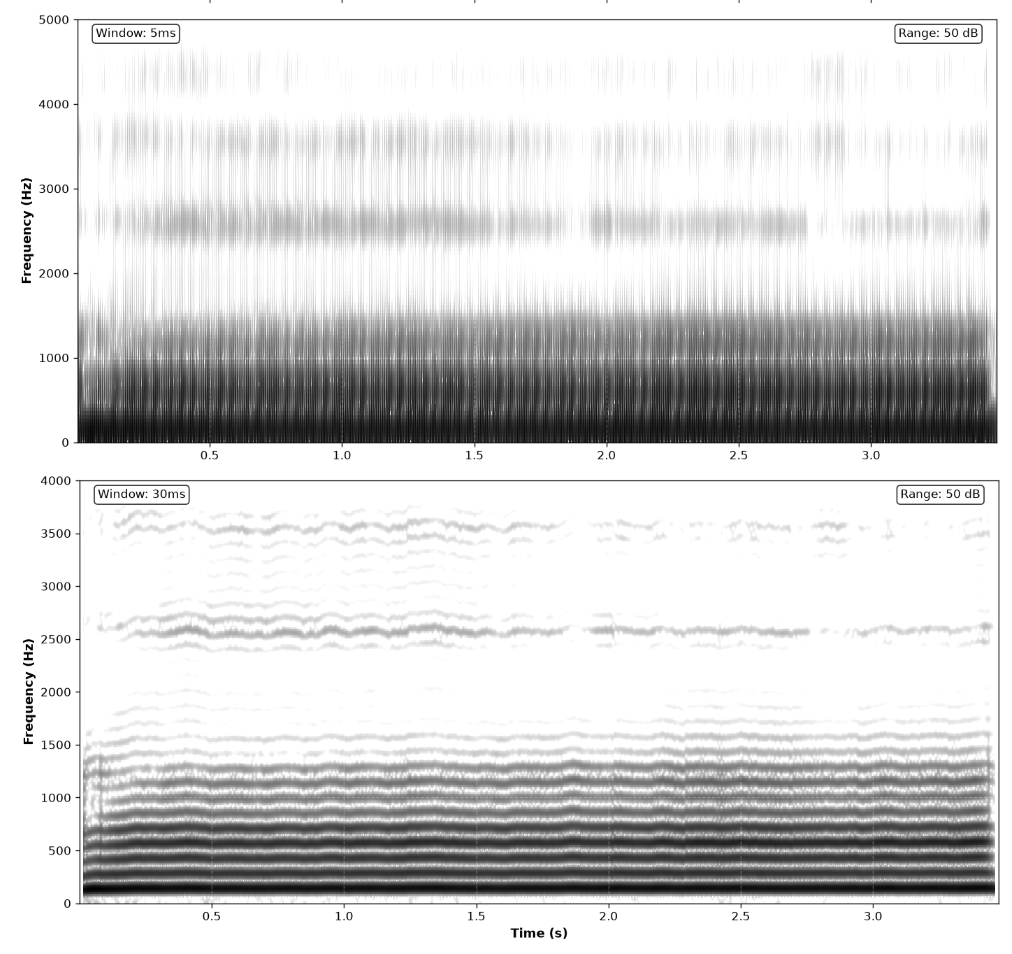
| Feature | Wideband | Narrowband |
|---|---|---|
| Window length | Short (3–5 ms) | Long (30–50 ms) |
| Frequency bandwidth | Wide (~260–300 Hz) | Narrow (~20–45 Hz) |
| Time resolution | Excellent | Poor |
| Frequency resolution | Poor | Excellent |
| Shows clearly | Formants, vertical striations (glottal pulses) | Harmonics, F0, subharmonics |
| Primary clinical use | Articulation, formant transitions | Voice quality, signal typing |
Wideband Spectrograms: See the Vocal Tract
Wideband spectrograms use short analysis windows (typically 4–5 ms in Praat). This provides excellent temporal resolution—you can see individual glottal pulses as vertical striations. The dark horizontal bands represent formants, the resonant frequencies of the vocal tract.
Use wideband for: Analyzing articulation, tracking formant transitions during connected speech, visualizing voice onset time, and seeing rapid temporal events. For clinical formant work, see our formant analysis guide.
Narrowband Spectrograms: See the Voice Source
Narrowband spectrograms use longer analysis windows (30–50 ms). This provides excellent frequency resolution—you can see individual harmonics as distinct horizontal lines. The spacing between harmonics equals F0 (fundamental frequency).
Use narrowband for: Voice quality assessment, signal typing, identifying subharmonics, detecting F0 instability, and evaluating periodicity.
Clinical Bottom Line
For clinical voice assessment, the narrowband spectrogram is preferred because it displays the characteristics of vocal fold vibration: F0, harmonics, noise, subharmonics, and periodicity. This is what you need for voice signal typing and determining which acoustic measures are valid for your patient.
Voice Signal Typing: The Critical First Step
Before you calculate jitter, shimmer, or any perturbation measure, you must determine your patient's voice signal type. This classification—Types 1–3 proposed by Ingo Titze in the 1995 NCVS Workshop on Acoustic Voice Analysis, Type 4 added by Sprecher and colleagues in 2010—determines which acoustic measures will produce valid results. A 2026 systematic review of three decades of signal-typing research describes it as exactly that: the gatekeeper for selecting valid analysis methods (Hegde et al., 2026).
This step is often missed in clinical practice—yet it's essential. Calculating jitter on a Type 3 voice is meaningless; the algorithm cannot reliably track pitch periods in an aperiodic signal. The full argument, including the software-dependence problem, is in our jitter and shimmer guide.
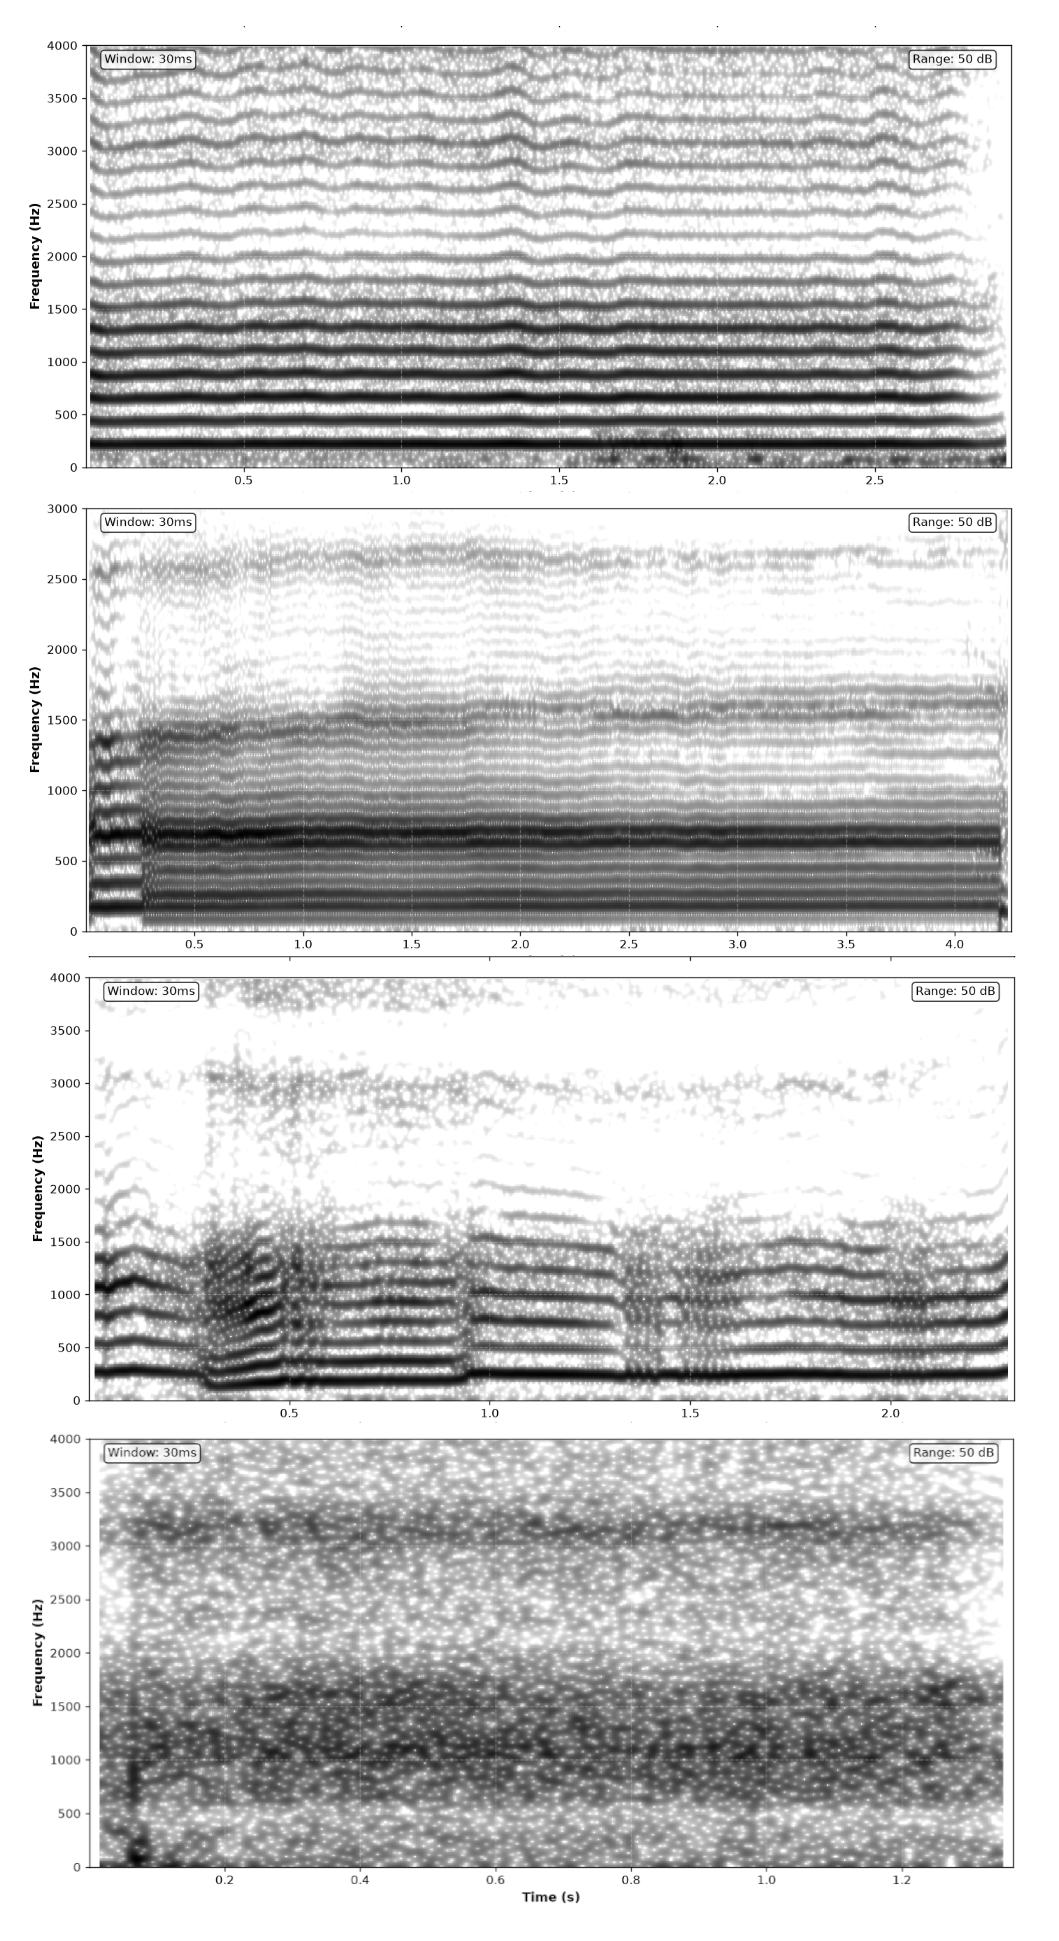
Type 1: Nearly Periodic
Spectrogram appearance: Clear, well-defined horizontal lines (harmonics) that appear nearly straight. Minimal noise between harmonics.
Clinical meaning: Healthy or mildly disordered voice with regular vocal fold vibration.
✓ Valid measures: Jitter, shimmer, HNR, CPP—all perturbation measures
Type 2: Subharmonics/Modulations
Spectrogram appearance: Additional horizontal lines between the harmonics. Harmonics may appear undulated rather than straight. Subharmonic frequencies visible.
Clinical meaning: Irregular vocal fold vibration with period doubling or amplitude modulation. Often seen in moderate dysphonia.
⚠ Valid approaches: CPP and visual spectrogram analysis—Titze's summary statement is explicit that visual displays are the tool for Type 2; perturbation measures are unreliable.
Type 3: Aperiodic/Chaotic
Spectrogram appearance: No clearly defined harmonic structure. Chaotic appearance with irregular energy distribution. Some pattern may still be discernible.
Clinical meaning: Severe dysphonia with chaotic (deterministic but aperiodic) vocal fold vibration.
⚠ Valid approaches: Perceptual rating (Titze's recommendation), CPP, spectrogram analysis. Jitter/shimmer invalid.
Type 4: Stochastic Noise (Sprecher et al., 2010)
Spectrogram appearance: No discernible periodicity. Appears as random noise with no harmonic structure—similar to white noise or severe breathiness.
Clinical meaning: Severely breathy voice, significant glottal incompetence, or aphonic segments. Noise, not deterministic vibration, dominates.
✗ Perceptual rating is primary. Perturbation and HNR are meaningless; CPP remains computable and will register very low—treat it as a severity floor, not a precise measurement.
Why This Matters Clinically
If you report jitter = 2.3% for a Type 3 voice, that number is meaningless. The algorithm couldn't reliably identify pitch periods, so it's essentially measuring noise, not actual cycle-to-cycle variation. This is why the 2018 ASHA instrumental protocol chose a cepstral measure as its acoustic index of voice quality—cepstral measures remain viable across the severity range (Patel et al., 2018; see our CPP guide).
Signal type can change within one recording
A 2025 pediatric study segmented sustained vowels from children with severe dysphonia and found that 11% of all samples—and 20% of samples with a supraglottal vibratory source—contained two or more signal types within the same recording; a model combining CPPS with envelope and sharpness measures predicted segment types with 81–96% accuracy (Park et al., 2025). The practical lesson for adult work too: type the specific segment you analyze, not the recording as a whole, and note in the chart when a sample is mixed.
Reading Harmonic Structure
In a narrowband spectrogram of a healthy voice, you'll see a series of horizontal lines stacked vertically. Each line is a harmonic—an integer multiple of the fundamental frequency (F0).
What Harmonics Tell You
- Harmonic spacing = F0: If the first harmonic is at 150 Hz and the second at 300 Hz, the fundamental frequency is 150 Hz.
- Number of visible harmonics: A healthy voice shows many well-defined harmonics across a 0–4 kHz narrowband view. A visibly reduced count of clear harmonics suggests increased noise or reduced harmonic energy.
- Harmonic clarity: Sharp, well-defined harmonics indicate good periodicity. Fuzzy, smeared, or undulating harmonics suggest instability.
- Interharmonic noise: Energy between harmonic lines indicates turbulent airflow (breathiness) or aperiodic vibration (roughness).
Subharmonics: The Period-Doubling Pattern
Subharmonics appear as additional horizontal lines between the regular harmonics. If you see lines at F0, 1.5×F0, 2×F0, 2.5×F0, etc., you're observing subharmonics at half the fundamental frequency—indicating the vocal folds are completing two different vibratory cycles in alternation.
Subharmonics are common in:
- Vocal fold lesions (nodules, polyps) affecting vibratory symmetry
- Unilateral vocal fold paralysis
- Pubertal voice change
- Intentional vocal effects (vocal fry, growl)
Visual Patterns of Voice Quality
Different voice quality dimensions produce characteristic spectrographic appearances. Learning to recognize these patterns accelerates your clinical interpretation.
Breathiness
Spectrogram Features:
- • Increased energy between harmonics (interharmonic noise)
- • Fuzzy, less distinct harmonic boundaries
- • Reduced number of visible higher harmonics
- • High-frequency noise band (aspiration noise) often visible above 2000 Hz
Roughness
Spectrogram Features:
- • Undulating or wavy harmonic contours
- • Presence of subharmonics (lines between harmonics)
- • Irregular harmonic spacing over time
- • Variable F0 visible as wobbling fundamental
Underlying Physiology:
Irregular vocal fold vibration from mass asymmetry, stiffness differences, or neuromuscular dysfunction. The periodicity is disrupted, creating cycle-to-cycle variation in both frequency and amplitude.
Strain/Pressed Voice
Spectrogram Features:
- • Strong, prominent harmonics extending to high frequencies
- • Reduced spectral tilt: enhanced energy in higher harmonics relative to F0
- • May show high-frequency noise from supraglottic constriction
- • In laryngeal dystonia, voice breaks appear as abrupt discontinuities
Underlying Physiology:
Increased medial compression and longitudinal tension of the vocal folds creates a more abrupt glottal closure, which generates stronger high-frequency harmonics (a flatter spectral slope). Often accompanied by supraglottic hyperfunction.
Tremor
Spectrogram Features:
- • Regular, rhythmic undulation of harmonics
- • Cyclic frequency or amplitude modulation (roughly 4–8 Hz)
- • Pattern repeats predictably throughout sustained phonation
- • May affect pitch, loudness, or both
Underlying Physiology:
Rhythmic oscillation of laryngeal or respiratory muscles, often related to neurological conditions (essential tremor, Parkinson's disease) or normal aging. The modulation rate and regularity help differentiate pathological from physiological tremor.
Spectrographic Patterns in Common Pathologies
While spectrograms alone cannot diagnose specific pathologies (that requires laryngeal examination), certain patterns are commonly associated with specific conditions. These associations can guide your clinical hypothesis and inform your referral decisions.
Vocal Fold Nodules
- •Mild to moderate interharmonic noise (breathiness)
- •Reduced higher harmonic energy
- •Usually Type 1 or borderline Type 2 signal
- •Voice breaks may appear as sudden discontinuities
Vocal Fold Polyp
- •More pronounced subharmonics (asymmetric vibration)
- •Often Type 2 signal with visible period doubling
- •Diplophonia may be visible as parallel harmonic tracks
- •Variable appearance depending on polyp size and location
Unilateral Vocal Fold Paralysis
- •Significant interharmonic noise (glottal incompetence)
- •Often prominent subharmonics from asymmetric vibration
- •May show diplophonia (two distinct F0 tracks)
- •Usually Type 2 or Type 3 signal
Reinke's Edema (Polypoid Corditis)
- •Abnormally low F0 (harmonic lines spaced closer together)
- •Increased harmonic instability (wavy contours)
- •Roughness pattern with aperiodicity
- •Bilateral involvement often creates irregular subharmonics
Remember: Spectrograms Inform, Don't Diagnose
These patterns are associated with specific pathologies, but similar patterns can result from different underlying conditions. A spectrogram showing subharmonics could indicate a polyp, paralysis, cyst, or functional disorder. Laryngeal visualization is always required for diagnosis.
Practical Protocol: Spectrogram Analysis in Clinical Workflow
Here's a systematic approach to incorporating spectrogram analysis into your voice assessment:
- 1
Generate a narrowband spectrogram first
In Praat, use View range 0–4000 Hz and Window length 0.03–0.05 seconds. For PhonaLab's Spectrogram Generator, select "Narrowband" mode.
- 2
Classify the voice signal type (1–4)—per segment
Are harmonics clearly defined? Are there subharmonics? Is the signal aperiodic or noise-dominated? Check whether the type is stable across the sample—mixed-type recordings are common in severe dysphonia (Park et al., 2025). Document the classification; it determines which acoustic measures are valid.
- 3
Assess harmonic clarity and number
Count visible harmonics. Note if they're sharp or fuzzy. Look for interharmonic noise indicating breathiness or aperiodicity.
- 4
Check for subharmonics and diplophonia
Look for additional horizontal lines between harmonics. Note if they're consistent (period doubling) or irregular (chaotic bifurcation).
- 5
Evaluate stability over time
Are harmonics straight (stable F0) or undulating (F0 instability, tremor)? Note any voice breaks, onset difficulties, or inconsistent segments.
- 6
Select appropriate acoustic measures
Based on signal type: Type 1 → perturbation measures valid; Types 2–4 → use CPP as the primary acoustic measure, with perturbation reported cautiously or not at all.
Recommended Praat Settings
For those using Praat, here are optimized settings for clinical voice spectrogram analysis:
Narrowband (Voice Quality Assessment)
- View range: 0 – 4000 Hz
- Window length: 0.03 – 0.05 s
- Dynamic range: 50 – 70 dB
- Number of time steps: 1000
- Number of frequency steps: 250
Wideband (Formant/Articulation Analysis)
- View range: 0 – 5000 Hz
- Window length: 0.004 – 0.005 s (Praat's default 0.005 s)
- Dynamic range: 50 – 70 dB
- Number of time steps: 1000
- Number of frequency steps: 250
Note for high-pitched voices: a wideband display only merges harmonics into formant bands when its analysis bandwidth exceeds the speaker's F0. The standard 5 ms window gives a bandwidth of roughly 260 Hz, so for women and children with F0 near or above that, the “wideband” display starts resolving individual harmonics and looks like a hybrid. The fix is a shorter window (try 0.003–0.0035 s) to widen the bandwidth. Narrowband display is the opposite case and is unaffected: high F0 spaces the harmonics further apart, which only makes them easier to see.
📊 Generate Clinical Spectrograms Instantly
PhonaLab's Spectrogram Generator creates publication-quality narrowband and wideband spectrograms with aligned waveforms. Upload any voice recording and visualize harmonic structure, noise, and voice quality patterns in seconds—no software installation required, and audio is never stored.
Try Free Spectrogram Generator →Wideband + narrowband options • Waveform overlay • Downloadable images
⚠️ Clinical Documentation Tool
The information in this article is provided for educational purposes and clinical workflow support. Spectrographic analysis should be interpreted within the context of comprehensive voice evaluation including perceptual assessment, patient history, and laryngeal visualization. All clinical decisions should be made by qualified healthcare professionals.
References & Further Reading
- Titze IR. (1995). Workshop on Acoustic Voice Analysis: Summary Statement. National Center for Voice and Speech. Available at https://ncvs.org/archive/freebooks/summary-statement.pdf
- Sprecher A, Olszewski A, Jiang JJ, Zhang Y. (2010). Updating signal typing in voice: Addition of type 4 signals. The Journal of the Acoustical Society of America, 127(6), 3710–3716.
- Barsties B, Hoffmann U, Maryn Y. (2016). The evaluation of voice quality via signal typing in voice using narrowband spectrograms [Spektrografische Stimmtypenklassifizierung zur Beurteilung der Stimmqualität]. Laryngo-Rhino-Otologie, 95(2), 105–111.
- Hegde PS, et al. (2026). Visual signal typing in voice assessment: A systematic review of methods, reliability, and clinical applications. Journal of Voice. Advance online publication. doi:10.1016/j.jvoice.2026.08.013
- Park Y, Anand S, Baker Brehm S, Kelchner L, Weinrich B, Shrivastav R, de Alarcon A, Eddins DA. (2025). Segment-based signal typing and predictive modeling in pediatric dysphonia with different vibratory sources. Journal of Speech, Language, and Hearing Research, 68(12), 5694–5707. doi:10.1044/2025_JSLHR-25-00264
- Patel RR, Awan SN, Barkmeier-Kraemer J, Courey M, Deliyski D, Eadie T, Paul D, Švec JG, Hillman R. (2018). Recommended protocols for instrumental assessment of voice: American Speech-Language-Hearing Association expert panel to develop a protocol for instrumental assessment of vocal function. American Journal of Speech-Language Pathology, 27(3), 887–905. doi:10.1044/2018_AJSLP-17-0009
- Maryn Y, Weenink D. (2015). Objective dysphonia measures in the program Praat: Smoothed cepstral peak prominence and Acoustic Voice Quality Index. Journal of Voice, 29(1), 35–43. doi:10.1016/j.jvoice.2014.06.015
- Baken RJ, Orlikoff RF. (2000). Clinical Measurement of Speech and Voice (2nd ed.). Singular Thomson Learning.