Formant Analysis for Voice Clinicians: Beyond F0
🎯 Key Takeaways
- Formants are vocal tract resonances—F1 relates to tongue height, F2 to tongue advancement, F3+ to voice quality and gender perception
- Gender perception research: F0 is primary, but studies show higher F2 values are associated with increased perceived femininity
- Vowel Space Area (VSA) from corner vowels has been shown to correlate with speech intelligibility in dysarthria research
- Praat settings matter: Literature recommends 5500 Hz ceiling for females, 5000 Hz for males, higher for children
- High F0 challenge: Formant estimation accuracy degrades as pitch increases—expected error is approximately F0/4
Most voice clinicians are comfortable with fundamental frequency—F0 tells us about pitch, and pitch is perceptually salient. But F0 is only part of the acoustic picture. The formants—the resonant frequencies of the vocal tract—determine vowel quality, contribute to voice timbre, influence gender perception, and provide objective markers of articulatory function.
Yet many speech-language pathologists report uncertainty about formants. The numbers can seem abstract. The analysis feels technical. And unlike F0 (which listeners perceive directly as pitch), formants don't map to a single perceptual quality—they work together to create the complex sensation of "voice quality."
This guide bridges that gap. It explains what formants are, what questions they help address in research and clinical contexts, and how to measure them reliably. The information presented draws on published acoustic phonetics research and voice science literature.
What Are Formants?
When the vocal folds vibrate, they produce a complex sound wave rich in harmonic frequencies. This raw "buzz" then travels through the vocal tract—the pharynx, oral cavity, and sometimes nasal cavity—which acts as a resonating chamber.
Formants are the resonant frequencies of the vocal tract. They selectively amplify certain harmonics while damping others, shaping the raw laryngeal buzz into recognizable speech sounds. By changing the shape of the vocal tract—moving the tongue, lips, and jaw—a speaker changes which frequencies are amplified, and therefore which vowel is produced.
The First Three Formants
Inversely related to tongue height. High vowels like /i/ ("ee") and /u/ ("oo") have low F1 because the tongue is raised, creating a small oral cavity volume. Low vowels like /a/ ("ah") have high F1 because the tongue is lowered.
Related to tongue frontness/backness. Front vowels like /i/ have high F2 because the tongue constriction is forward, creating a short front cavity. Back vowels like /u/ have low F2. Lip rounding also lowers F2.
Influenced by lip rounding and pharynx configuration. F3 contributes to voice quality and speaker identification. Research indicates F3 and higher formants play a role in gender perception beyond the vowel-determining F1 and F2.
The Vowel Quadrilateral: F1 × F2 Space
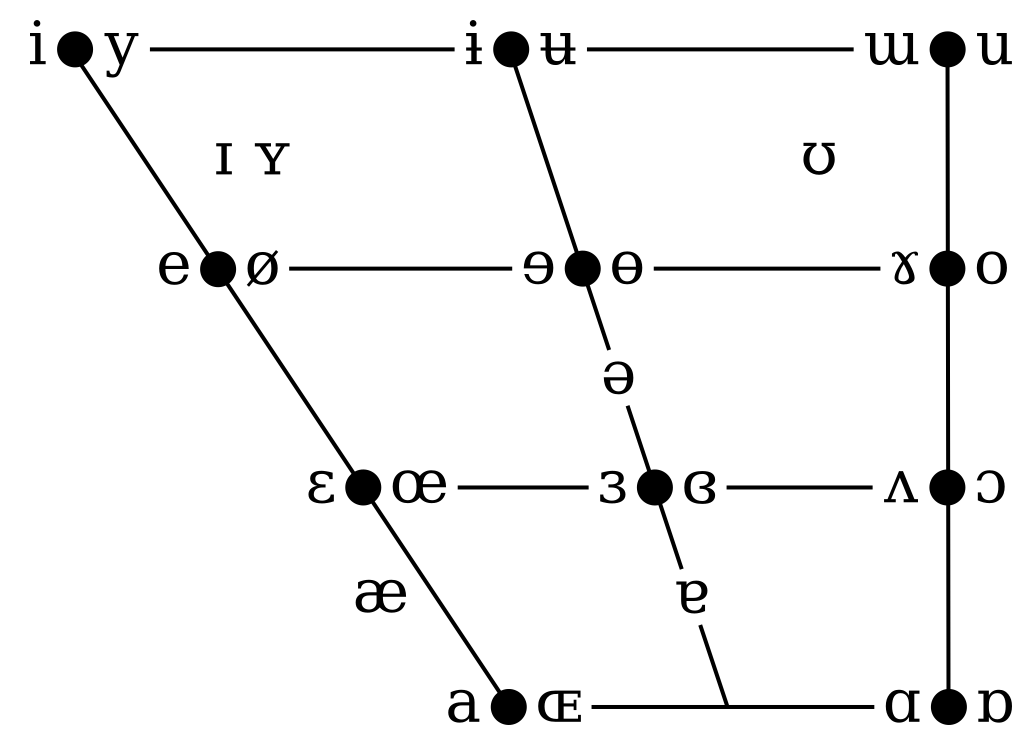
The traditional IPA vowel quadrilateral corresponds closely to an F1-by-F2 plot with inverted axes. When phoneticians describe vowels articulatorily (high/low, front/back), they are essentially describing formant patterns. Source: Wikimedia Commons, CC BY-SA 4.0.
F0 Is Not a Formant
The fundamental frequency (F0) is the rate of vocal fold vibration—what listeners perceive as pitch. Though sometimes labeled "F0" alongside formants F1, F2, F3, it is fundamentally different. F0 is a source characteristic; formants are filter characteristics. A speaker can change F0 (by adjusting vocal fold tension) independently of formants (which depend on vocal tract shape), and vice versa.
Normative Formant Values
Formant frequencies vary by vowel, speaker sex, age, and individual vocal tract anatomy. The classic normative data comes from Peterson & Barney (1952) and Hillenbrand et al. (1995). The following table shows representative values for American English corner vowels:
| Vowel | Adult Males | Adult Females | ||||
|---|---|---|---|---|---|---|
| F1 | F2 | F3 | F1 | F2 | F3 | |
| /i/ ("heed") | 342 | 2322 | 3000 | 437 | 2761 | 3372 |
| /æ/ ("had") | 588 | 1952 | 2601 | 669 | 2349 | 2972 |
| /ɑ/ ("hod") | 768 | 1333 | 2522 | 936 | 1551 | 2815 |
| /u/ ("who'd") | 378 | 997 | 2343 | 459 | 1105 | 2735 |
Values in Hz. Data from Hillenbrand et al. (1995).
Why the sex difference? Adult males have longer vocal tracts (average ~17 cm) than adult females (~14.5 cm). Longer tubes resonate at lower frequencies, so male formants are typically 10–20% lower than female formants for the same vowel. Research indicates this difference contributes to gender perception—even when F0 is controlled.
Children have even shorter vocal tracts and correspondingly higher formants. As children grow, formants decrease, with sex differences emerging around age 4–7 for different formants—earlier than the dramatic F0 changes of puberty.
Formants and Gender Perception: Research Findings
Gender perception from voice involves multiple cues: F0, formants, intonation, resonance, speech patterns, and more. While F0 remains the single strongest predictor of gender attribution in research studies, published evidence increasingly shows that formants contribute independently to perceived femininity or masculinity.
What the Published Literature Shows
- F0 is necessary but not sufficient. Studies report that a minimum F0 of approximately 180 Hz is associated with voices being perceived as feminine, but high F0 alone does not guarantee feminine attribution.
- Higher F2 is associated with increased perceived femininity. Visual-acoustic biofeedback studies have demonstrated that speakers can learn to shift F2 upward, and listeners rate higher F2 values as more feminine—even when F0 is held constant (Carew et al., 2007; Hardy et al., 2020).
- The vowel /i/ appears particularly diagnostic. Research indicates that average formant frequency of /i/, especially F2, predicts masculinity-femininity ratings in connected speech samples.
- F3 and F4 also contribute. Higher formants appear to contribute to the "brightness" or "resonance" qualities that differentiate masculine and feminine voice timbres in perception studies.
Articulatory Correlates of Higher Formants
According to acoustic phonetics principles, F2 can be raised through forward tongue carriage—maintaining a tongue position similar to the vowel /i/ across other vowels. Additionally, lip spreading (vs. lip rounding) raises F2, while a shortened vocal tract (via slightly raised larynx, forward tongue) raises all formants.
The opposite articulatory patterns—back tongue position, lip rounding, lengthened vocal tract—are associated with lower formant frequencies.
Research context: Studies on voice and gender perception note that achieving natural-sounding voice modification involves multiple acoustic parameters working together. Formant modification appears most effective as part of a holistic approach that also addresses F0, intonation, speech patterns, and other communication behaviors.
Formants and Semi-Occluded Vocal Tract Exercises
Resonant voice therapy (such as Lessac-Madsen Resonant Voice Therapy) and semi-occluded vocal tract exercises (SOVT) are evidence-based approaches documented in the voice therapy literature. Though often described perceptually in terms of "forward resonance" and "facial buzz," these techniques have measurable effects on formant patterns according to acoustic studies.
Acoustic Effects of SOVT Exercises (Research Findings)
When phonating through a straw, tube, or with lips narrowed (as in humming or lip trills), the semi-occlusion changes the acoustic properties of the vocal tract. Published studies report:
- F1 lowers significantly—computational models by Titze & Laukkanen show F1 dropping from ~300 Hz to ~150 Hz during tube phonation
- Inertive reactance increases—this acoustic effect is theorized to help "push back" on the vocal folds, potentially reducing collision force and phonation threshold pressure
- Pharynx often widens—CT imaging studies show enlarged pharyngeal area during and after tube/straw phonation
- Larynx position often lowers—associated with a more relaxed phonatory posture in imaging studies
In the voice science literature, resonant voice has been defined as voice that feels "easy to produce and buzzy in the facial tissues" (Verdolini-Marston et al., 1995). The acoustic correlate described is a reinforcement of the voice source by the vocal tract—what Titze calls "source-filter interaction." Research indicates that during resonant phonation, the closed quotient (the proportion of each cycle when the vocal folds are in contact) is moderate (0.5–0.6), suggesting efficient phonation.
Practical note: Understanding that SOVT exercises work by changing vocal tract acoustics—not just subjective "placement"—provides a scientific framework for these techniques, though the mechanisms continue to be studied.
Vowel Space Area in Dysarthria Research
One well-documented application of formant analysis in the research literature is calculating Vowel Space Area (VSA)—a measure of articulatory working space derived from the corner vowels. VSA has been studied extensively in motor speech disorders, where reduced articulatory excursion leads to vowel centralization.
Calculating Vowel Space Area
VSA is calculated by plotting the F1 and F2 values of the four corner vowels (/i/, /u/, /æ/, /ɑ/) on a graph, connecting them to form a quadrilateral, and computing the area (in Hz²):
Larger VSA = greater acoustic distinctiveness between vowels. Smaller VSA = vowel centralization.
Populations Studied:
- • Parkinson's disease (hypokinetic dysarthria)
- • ALS (mixed dysarthria)
- • Huntington's disease
- • Multiple sclerosis
- • Cerebral palsy
- • Traumatic brain injury
Reduced VSA has been reported in these populations compared to healthy controls (Lansford & Liss, 2014; Sapir et al., 2010).
Research Applications:
- • Detecting presence of dysarthria
- • Correlating with speech intelligibility measures
- • Tracking changes over time
- • Examining speaking rate effects
- • Analyzing passage reading samples
Studies report VSA explains ~25–65% of intelligibility variance, depending on population and methodology.
Alternative Metric: Formant Centralization Ratio (FCR)
Sapir et al. (2010) proposed the FCR as an alternative metric that may be more sensitive to vowel centralization while minimizing inter-speaker variability:
FCR = (F2u + F2a + F1i + F1a) / (F2i + F1a)
FCR values > 1 indicate vowel centralization. Studies have shown FCR can distinguish hypokinetic dysarthria from healthy controls in some cases where traditional VSA does not.
Research limitation: Studies indicate VSA is more effective at detecting the presence of dysarthria than differentiating dysarthria subtypes. Speakers with Parkinson's, ALS, and ataxia may all show reduced VSA despite different underlying pathophysiology.
The Singer's Formant: Research on Vocal Projection
Voice science research has documented the "singer's formant"—an acoustic phenomenon that allows trained operatic voices to project over orchestras without amplification. This research is relevant to understanding professional voice use and trained voice production.
What Research Shows About the Singer's Formant
According to Sundberg (1974) and subsequent research, the singer's formant is a prominent spectral peak near 2.5–3.5 kHz that results from the clustering of F3, F4, and F5 into a single reinforced peak. Imaging and acoustic studies indicate it is produced when singers narrow the epilaryngeal tube while widening the pharynx—creating acoustic conditions that concentrate energy in a frequency region where orchestral energy is relatively low.
Bass: ~2400 Hz
Baritone: ~2600 Hz
Tenor: ~2800 Hz
Soprano: ~3100 Hz
"Ring," "Squillo" (Italian for trumpet-like brilliance), "Presence," "Carrying power"
Soprano research: Studies (Weiss et al., 2001; Sundberg, 2003) indicate that at high pitches (above ~G5), the wide harmonic spacing means sopranos cannot effectively use the F3–F5 clustering strategy. Instead, research suggests they use "formant tuning"—adjusting the first resonance (F1) to align with the fundamental frequency (F0), maximizing acoustic output through a different mechanism.
Measuring Formants: Practical Guidelines
Formant estimation requires appropriate software settings. The most common method—Linear Predictive Coding (LPC)—works by fitting a model of the vocal tract to the speech signal. If the model parameters don't match the speaker, the estimated formants will be inaccurate.
Recommended Praat Settings (from Literature)
| Speaker Type | Formant Ceiling | Number of Formants |
|---|---|---|
| Adult male | 5000 Hz | 5 |
| Adult female | 5500 Hz (Praat default) | 5 |
| Child (young) | 7000–8000 Hz | 5 |
| Atypical speech | May require adjustment | Adjust based on output |
General guideline from Praat documentation: Expect approximately 1 formant per 1000 Hz for males, 1 per 1100 Hz for females. These settings should be verified against the spectrogram for each speaker.
The High F0 Problem
Formant estimation accuracy degrades as F0 increases. The widely spaced harmonics of high-pitched voices undersample the vocal tract transfer function, making it harder to identify resonance peaks. According to Kent & Vorperian (2018), expected accuracy is approximately F0/4—so for a child with F0 of 250 Hz, expect ±60 Hz error in formant estimates.
Practical implication: Interpret formant data from children, high-pitched speakers, and sopranos with appropriate caution. Consider visually verifying formant tracks against the spectrogram.
1. Measure at Vowel Midpoint
Formants are most stable at the temporal midpoint of sustained vowels, away from coarticulatory transitions. For connected speech, the "steady state" portion of each vowel is typically analyzed.
2. Verify Against Spectrogram
Automatic formant tracks should be checked against the visible dark bands (formants) on the spectrogram. LPC sometimes merges two close formants into one, or identifies spurious "formants" where none exists.
3. Use Consistent Settings for Comparisons
Formant values differ across software packages and settings. For longitudinal comparisons, identical analysis parameters should be used at each measurement point. Values from different software (e.g., Praat vs. CSL) should not be directly compared.
4. Consider the Vowel
Different vowels have different inherent formant frequencies. When comparing across speakers or sessions, the same vowel(s) should be analyzed. In gender perception research, /i/ is often analyzed because its high F2 is diagnostically relevant.
Limitations of Formant Analysis
Formant analysis is a powerful acoustic tool but has known limitations. In many contexts, simpler measures or perceptual assessment may provide sufficient information.
Known Limitations
- •High F0 degrades accuracy—formant estimation is less reliable for children, sopranos, and high-pitched speakers
- •Software disagreement—different programs (Praat, CSL, MDVP) may produce different values for the same sample
- •Recording quality sensitivity—formants require clean recordings for reliable estimation
- •Severe dysphonia challenges—aperiodic voices can produce unreliable formant tracking
- •Coarticulation effects—formants vary continuously during connected speech
Formant analysis is most informative when resonance, vowel quality, articulatory precision, or gender perception is the specific question being investigated. For general voice quality assessment, measures like CPPS and multiparametric indices (AVQI) often provide relevant information with less technical complexity.
Frequently Asked Questions
Q: Can smartphone recordings be used for formant analysis?
With caution. Smartphone microphones and audio compression can affect spectral characteristics. Research protocols typically use quality condenser microphones and uncompressed recording formats (WAV). Smartphone recordings may be acceptable for gross comparisons but not for precise measurements requiring high accuracy.
Q: What's the difference between formant frequency and formant bandwidth?
Frequency is the center; bandwidth is the spread. A formant at 500 Hz with narrow bandwidth is a sharp resonance peak; the same frequency with wide bandwidth is a flatter peak. Wider bandwidths are associated with increased damping (e.g., from nasalization or breathy voice). Most formant analysis focuses on frequencies, but bandwidths provide additional information about voice quality.
Q: Why do F1 and F2 sometimes seem to merge on the spectrogram?
This occurs with back vowels. For /u/ and /o/, F1 and F2 are close in frequency, sometimes appearing as a single dark band. LPC may track them as separate formants, but visually they overlap. This is expected and reflects the acoustic properties of these vowels.
Q: How might formants be explained to patients or clients?
A resonance metaphor is often used. The voice box makes a buzz, like blowing a raspberry. The throat, mouth, and lips shape that buzz into speech sounds—similar to how the shape of a guitar body affects its tone. Formants are those shaping frequencies. Changing mouth shape changes the sound.
Q: Should formants be measured in sustained vowels or connected speech?
It depends on the research question. Sustained vowels are easier to measure and provide cleaner data for acoustic comparisons. Connected speech has better ecological validity—formant patterns in running speech may differ from isolated vowels. Research on VSA in dysarthria has used both approaches.
Summary
- 1Formants are vocal tract resonances—F1 tracks tongue height, F2 tracks tongue advancement, F3+ influence voice quality and gender perception
- 2Gender perception research shows F2 contributes to perceived femininity independently of F0 effects
- 3SOVT exercises produce measurable acoustic effects including F1 lowering and increased vocal tract reactance
- 4Vowel Space Area from F1-F2 corner vowels is used in dysarthria research to quantify articulatory undershoot
- 5Analysis settings matter—formant ceiling and number of formants should be adjusted for speaker sex, age, and vocal tract characteristics
- 6High F0 degrades accuracy—formant estimation for children and high-pitched speakers requires additional caution
📊 Visualize Formants with PhonaLab
The PhonaLab Pitch Visualizer computes F1, F2, and F3 values for sustained vowels, alongside F0 tracking. The Voice Analyzer provides additional acoustic measures including F0, jitter, shimmer, HNR, and CPPS.
Try Pitch Visualizer →Free with PhonaLab account • Spectrogram + formant values for sustained vowels
⚠️ Educational Information
This article presents acoustic phonetics concepts and summarizes published research findings for educational purposes. It does not constitute clinical advice, diagnostic guidance, or treatment recommendations. Clinical decisions regarding voice assessment and intervention should be made by qualified, licensed healthcare professionals based on comprehensive evaluation of individual patients. PhonaLab provides acoustic measurement tools; it does not provide clinical interpretations or medical diagnoses.
References & Further Reading
- Hillenbrand J, Getty LA, Clark MJ, Wheeler K. (1995). Acoustic characteristics of American English vowels. Journal of the Acoustical Society of America, 97(5), 3099-3111.
- Hardy TLD, Rieger JM, Wells K, Boliek CA. (2020). Acoustic predictors of gender attribution, masculinity-femininity, and vocal naturalness ratings amongst transgender and cisgender speakers.Journal of Voice, 34(2), 300.e11.
- Carew L, Dacakis G, Oates J. (2007). The effectiveness of oral resonance therapy on the perception of femininity of voice in male-to-female transsexuals. Journal of Voice, 21(5), 591-603.
- Titze IR, Verdolini Abbott K. (2012). Vocology: The Science and Practice of Voice Habilitation. National Center for Voice and Speech.
- Sapir S, Ramig LO, Spielman JL, Fox C. (2010). Formant centralization ratio: A proposal for a new acoustic measure of dysarthric speech. Journal of Speech, Language, and Hearing Research, 53(1), 114-125.
- Sundberg J. (1974). Articulatory interpretation of the "singing formant."Journal of the Acoustical Society of America, 55(4), 838-844.
- Kent RD, Vorperian HK. (2018). Static measurements of vowel formant frequencies and bandwidths: A review. Journal of Communication Disorders, 74, 74-97.
- Lansford KL, Liss JM. (2014). Vowel acoustics in dysarthria: Speech disorder diagnosis and classification. Journal of Speech, Language, and Hearing Research, 57(1), 57-67.
- Verdolini-Marston K, Burke MK, Lessac A, Glaze L, Caldwell E. (1995). Preliminary study of two methods of treatment for laryngeal nodules. Journal of Voice, 9(1), 74-85.